Most teams file site speed under SEO, a box to tick before the next Google update. That framing quietly costs them money. Page speed is not a ranking detail, it is a checkout detail. Every extra second a page needs to become usable, a slice of your visitors give up and leave with their wallets still shut. When a client asks our team to look at their web development and just make the site faster, the real question underneath is almost always revenue, even when nobody says the word out loud.
So this is a playbook for reading Core Web Vitals as money, not hygiene. I will walk through the 2026 metric set, LCP, INP, and CLS, now that INP has replaced FID as the responsiveness metric. Then the revenue numbers real retailers have published, where the more than half of mobile sites that fail actually bleed conversions, and a fix-priority list ordered so the biggest revenue wins come first.
revenue-per-visitor lift Rakuten 24 measured after cutting its Largest Contentful Paint
of conversions lost for every extra 100ms of load time
of mobile sites that pass all three Core Web Vitals in recent field data
Does site speed really affect revenue?
The short answer is yes, directly and in numbers you can bank. Speed is not a proxy for quality that Google rewards from a distance; it is the friction a real buyer feels between wanting your product and paying for it. The most quoted figure in the field, roughly one percent of conversions lost for every extra 100 milliseconds of load time, has held up across studies for close to two decades because it describes human patience, not a search algorithm.
The bounce data is just as blunt. Google's research found that as mobile page load goes from one second to three, the probability that a visitor bounces climbs about 32 percent; stretch it to five seconds and that probability roughly doubles. Those are people who already found you, already intended to look, and left because the page made them wait. Speed does also feed rankings and even how answer engines surface your pages, but that is the smaller prize. The money is in the visitors who already arrived and decide, in the first few seconds, whether you are worth their time.
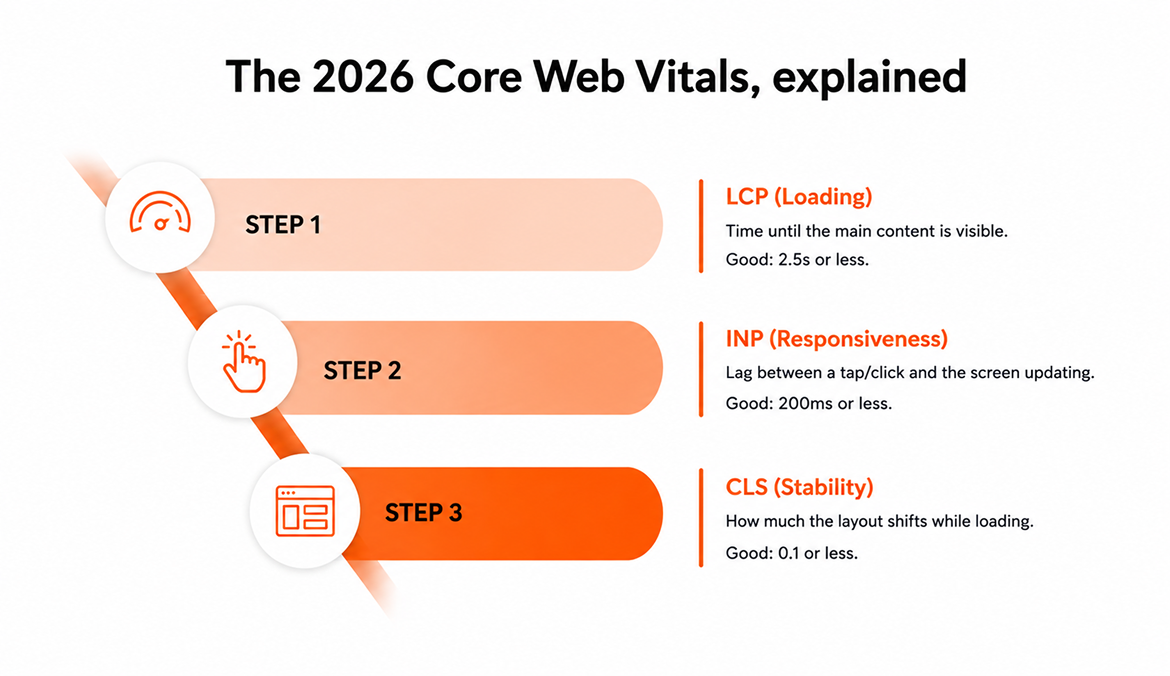
The 2026 Core Web Vitals, explained
Core Web Vitals are three field metrics Google uses to score real-world experience: Largest Contentful Paint (LCP) for loading, Interaction to Next Paint (INP) for responsiveness, and Cumulative Layout Shift (CLS) for visual stability. Each has a "good" threshold measured at the 75th percentile of your real visitors, and each maps to a distinct moment where someone decides to keep going or give up. Here is the set, with the threshold and where the money leaks when you miss it.
| Metric | What it measures | Good (p75) | Where the money leaks |
|---|---|---|---|
| LCP (loading) | Time until the main content is visible | 2.5 seconds or less | Slow first paint drives the biggest bounce, before a visitor sees anything worth staying for |
| INP (responsiveness) | Lag between a tap or click and the screen updating | 200 milliseconds or less | A laggy filter, menu, or add-to-cart makes the site feel broken and kills mid-funnel intent |
| CLS (stability) | How much the layout shifts while loading | 0.1 or less | Content that jumps causes mis-taps and accidental clicks, which erodes trust at the worst moment |
The thresholds are pass-or-fail as a group. You can have a beautiful 1.9-second LCP and still fail Core Web Vitals because your INP sits at 400 milliseconds. That is why a single "we're fast" gut feeling is worthless; you need all three, measured on real phones.
The money case: what speed is actually worth
Published retail case studies put hard numbers on this, and they are not small. Rakuten 24 cut its LCP by 61 percent and, in a controlled test, measured a 53.4 percent lift in revenue per visitor, a 33.1 percent lift in conversion rate, and a 15.2 percent rise in average order value. Vodafone improved LCP by 31 percent on one page and saw sales climb 8 percent. And Deloitte's "Milliseconds Make Millions" study found that a mere 0.1-second improvement in mobile load time lifted retail conversions by 8.4 percent and average order value by 9.2 percent.
None of those are our clients; they are public studies, and I cite them because the pattern holds from global retail down to a regional store. Tenths of a second move real money. If you are budgeting a store rebuild, this is exactly why we tell people that speed work belongs in the core scope, not a phase-two nice-to-have. It changes the return on the whole build, and it is worth weighing against what an ecommerce website actually costs to run.
Where sites actually lose it: mobile
Mobile is where the leak is. Only about 48 percent of mobile sites pass all three Core Web Vitals in recent Chrome UX Report data, up from the low 30s a few years ago but still leaving more than half failing, on the exact devices where most traffic and a growing share of checkout now happen. Desktop numbers run better, which is precisely the trap: teams build and test on fast laptops and never feel what a real customer feels.
Mobile fails for physical reasons. Phone processors are slower, so the JavaScript that runs fine on your machine chokes the main thread on theirs. Networks are patchy, so a two-megabyte hero image that loads instantly for you takes four seconds for them. And a lot of what reads as "slow" is really instability: content that shifts as ads, images, and late fonts pop in. That jumping is a UI and UX design problem as much as an engineering one, and it is a leading cause of the accidental taps that make people abandon a cart in frustration.
The fix-priority list: biggest revenue wins first
Fix in revenue order, not alphabetical order. Most teams start with whatever their tooling flags loudest, which scatters effort. The sequence that recovers the most money fastest, in our experience, runs like this:
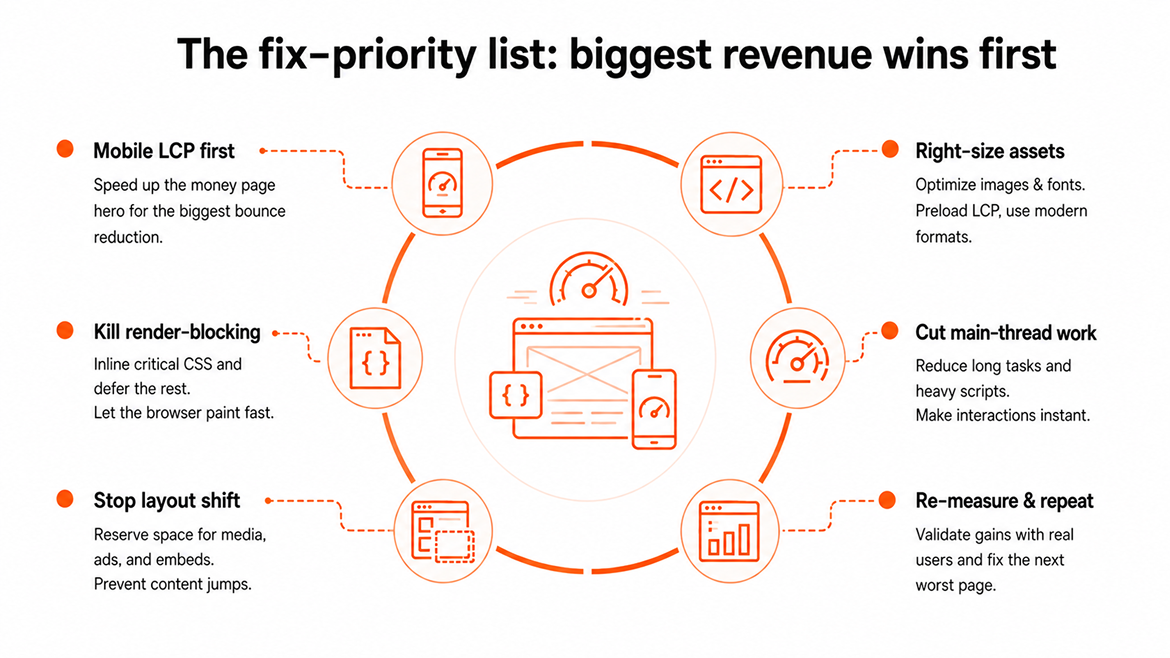
- Mobile LCP on the money page first. The hero image or headline above the fold on your highest-value page. This is the single biggest bounce driver, so it earns back the most.
- Kill render-blocking CSS and JavaScript. Inline the critical CSS and defer the rest so the browser paints without waiting on scripts. Often the cheapest large win.
- Right-size images and fonts. Modern formats, correct dimensions, a preloaded LCP image, and self-hosted fonts with swap. This is where mobile weight quietly balloons.
- Cut main-thread work for INP. Break long tasks, defer non-essential JavaScript, and audit heavy third-party tags so taps and filters feel instant.
- Stop layout shift for CLS. Set width and height on media, reserve space for ads and embeds, and stop content from jumping into a tap.
- Re-measure and move to the next worst page. Confirm the win on real users, then repeat the loop where the next chunk of revenue lives.
Field data vs lab data: measure the right thing
Measure the field, not the lab, when the question is money. Lab tools like Lighthouse run your page on one simulated device and one simulated network in a clean room. That is perfect for debugging a specific change, because it is repeatable. It is close to useless as a verdict, because your real customers are not a clean room. A page can score 95 in Lighthouse and still fail Core Web Vitals in the wild.
Field data is the truth serum. The Chrome User Experience Report and your own real-user monitoring capture what actual visitors on actual phones experienced, reported at the 75th percentile over a rolling 28-day window. That is the number Google ranks on and the number that predicts revenue. Use lab data to diagnose and field data to decide. Sometimes the field points past code to the platform itself, a heavy theme or plugin stack, and the honest fix is architectural, which is where the tradeoffs in headless versus traditional CMS start to matter.
The INP shift: what changed from FID
In March 2024, Interaction to Next Paint (INP) replaced First Input Delay (FID) as the responsiveness Core Web Vital, and the change is not cosmetic. FID only measured the delay before your very first interaction began processing. It ignored everything after that first tap, which made it an easy metric to pass and a poor picture of how a site actually feels to use.
INP measures the full latency of interactions across the whole visit, input delay plus processing time plus the rendering that follows, and it reports close to the worst interaction a user hits. That is why plenty of sites that comfortably passed FID now fail INP: the metric finally catches the janky menu on tap three, the slow filter on tap ten, the laggy add-to-cart deep in the session. The good threshold is 200 milliseconds or less, poor is over 500, and the fix is almost always leaner JavaScript and less main-thread work. INP rewards the sites that keep the main thread free and punishes the ones drowning in third-party scripts.
How we do performance work
Our approach is boring on purpose. We start from field data, not a Lighthouse screenshot, then tie each failing metric to the specific page that makes money and fix in the revenue order above. LCP on the converting page, render-blocking resources, image and font weight, INP, then CLS, then re-measure on real users and repeat. No redesign theater, no chasing a green score that no customer will ever see.
We are a CMMI Level 5 team of 80-plus engineers who have shipped for 700-plus companies, and performance is baked into how we build rather than sold as a rescue package. If your analytics show healthy traffic but soft conversion, speed is the first place I would look, because it is usually the cheapest revenue sitting on the table. Tell us which page has to convert and we will measure it against real-user data and show you, in revenue terms, what fixing it is worth.
Frequently Asked Questions
Does page speed really affect conversion rate?
Yes, and the effect is direct. The durable rule of thumb is that roughly one percent of conversions are lost for every extra 100 milliseconds of load time, and Google's own research found bounce probability rises about 32 percent when load time goes from one second to three. Speed is friction between wanting to buy and paying, and buyers feel it long before any ranking does.
What are the Core Web Vitals thresholds in 2026?
Three metrics, each judged at the 75th percentile of your real visitors. Largest Contentful Paint (LCP) should be 2.5 seconds or less, Interaction to Next Paint (INP) 200 milliseconds or less, and Cumulative Layout Shift (CLS) 0.1 or less. Pass all three and you clear Core Web Vitals; miss even one and the whole page is marked as failing.
What is INP and how is it different from FID?
Interaction to Next Paint replaced First Input Delay in March 2024. FID only measured the delay before your first tap started processing, an easy metric that ignored everything after it. INP measures the full latency of interactions across the entire visit, input delay plus processing plus rendering, and reports close to the worst one. Many sites that quietly passed FID now fail INP.
Why do so many mobile sites fail Core Web Vitals?
Only about 48 percent of mobile sites pass all three, because mobile is the hard case: slower processors, patchy networks, and heavy images or scripts that were written and tested on a fast laptop. Layout shift from ads and dimensionless images makes it worse. Most sites are built desktop-first and pay for it exactly where the traffic is.
Should I use Lighthouse or field data to measure speed?
Use both, for different jobs. Lab tools like Lighthouse simulate one device on one network and are ideal for debugging a specific fix. Field data, from the Chrome User Experience Report or your own real-user monitoring, is what real visitors feel and what Google ranks on. When the question is revenue, trust the field; a page can score 95 in the lab and still fail real users.
Have a project in mind? Let's scope it together.
You get a named team, written estimates, full code and IP ownership, and 48-hour response times. CMMI Level 5 certified. 700+ projects delivered across the UK, US, UAE, and Australia.